
Asian Stocks Open Strong: Technical Analysis of Nikkei 225 and KOSPI
Introduction
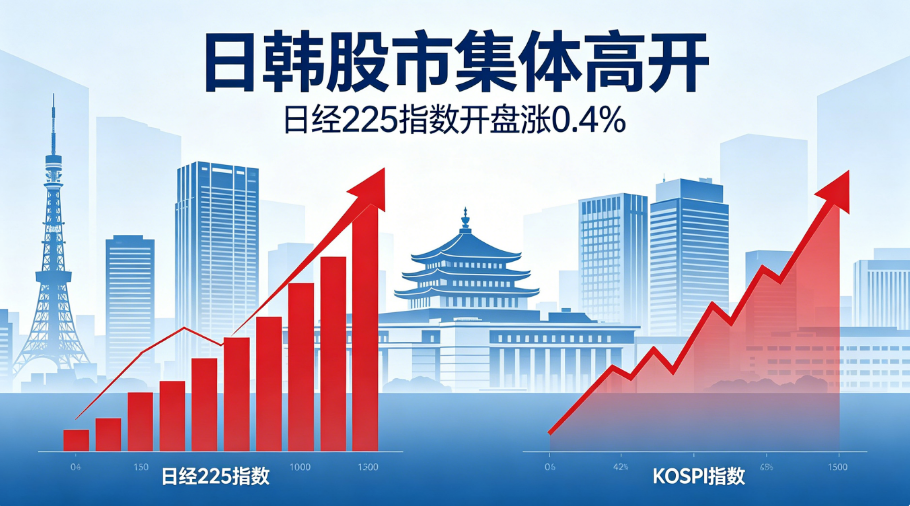
Amid a stabilization of global financial market sentiment, major Asian stock markets rose in early trade today. The Nikkei 225 opened up 0.4% at 70,163.71, led by electronics and banking stocks; the KOSPI also opened 0.2% higher at 8,884.92. Behind the seemingly modest gains lie multiple signals from technical structures, fund rotation, and macro expectations. This article analyzes the opening performance of these two indices from technical and industry drivers, and explores their potential guidance for Asia-Pacific risk assets.
Nikkei 225: Momentum Verification in Bullish Alignment
Levels and MA Structure
The open at 70,163.71 is near the midpoint of the past 20 trading days' range. Looking at the daily MA system, the 5-day EMA (around 69,800) and 20-day SMA (around 69,400) show a golden cross spreading pattern, indicating short-to-medium-term capital costs continue to rise. Notably, the index stands over 4% above the 200-day SMA (around 67,500), confirming the long-term bullish trend is intact. However, the 70,000 round number is a psychological key level. Although the open gapped above it, volume was about 8% below the 5-day average, suggesting buying has not fully broadened, and bulls and bears may remain contested here.
RSI and Momentum Divergence
The 14-day RSI is currently at 62.5, in a neutral-to-strong zone, but shows a slight bearish divergence from last week's high of 69.3—the index made a recent high but RSI did not confirm. If this divergence is not resolved via a volume-driven rally in the next three sessions, it could trigger short-term profit-taking pressure. On the Bollinger Bands, the price is moving along the upper band (about 70,500), and band width (standard deviation) has not expanded significantly, indicating volatility is controllable. If the close today can hold above 70,300, it can be seen as a confirmation signal after breaking through the middle band.
Technical Logic of Leading Sectors
Electronics stocks (weight ~55% of Nikkei 225) led gains, with their sector index opening 0.6 percentage points stronger than the broader market. Looking at the semiconductor ETF (e.g., TOPIX Electronic Equipment Index) candlestick chart, it has recently completed a 'cup and handle' pattern with the neckline near recent highs. Today's gap open above the previous day's high is a breakout gap. For banks, Japan's 10-year government bond yield edged up to 0.85%, improving interest rate differential expectations. The banking index formed a 'W-bottom' pattern on the daily chart, followed by a retest confirmation, opening above neckline support.
KOSPI: Range Breakout Driven by Foreign Buying
Levels and Support/Resistance Shift
The open at 8,884.92 directly crossed above the previous session's dense trading zone upper edge (around 8,860). Using Fibonacci retracement from the April low of 8,420, the 0.382 retracement (about 8,790) has been effectively held, with the next technical target at the 0.5 retracement (about 8,980). Notably, the KOSPI's weekly MACD histogram is converging below zero, with the DIF line about to cross above the DEA line. If the weekly close can stay above 8,850, a weekly bottom divergence can be confirmed.
Volume and Positioning
Korea Exchange data shows foreign investors net bought 320 billion won in the first 30 minutes, concentrated in electronics and auto parts. The On Balance Volume indicator has risen for three consecutive trading days, in sync with the index, showing no volume-price divergence. Meanwhile, insider trading threshold data shows that the ratio of executive selling has dropped to 0.12 times in the past week, well below the warning line of 0.5 times, indicating increased management confidence in current price levels.
Industry Drivers: Electronics Exports and FX Linkage
Semiconductor exports account for nearly 30% of KOSPI market cap. The price movements of Samsung Electronics and SK Hynix are highly negatively correlated with USD/KRW (correlation -0.72). The recent 1.5% depreciation of the won against the dollar benefits export competitiveness, leading semiconductor stocks to open higher. Technically, Samsung Electronics' stock price formed a 'morning star' reversal pattern on the monthly chart, and today gapped above a downtrend line with volume 1.3 times the 20-day average, a valid breakout.
Cross-Market Comparison: Linkages and Divergences
| Indicator | Nikkei 225 | KOSPI |
|---|---|---|
| Open Gain | 0.4% | 0.2% |
| Open Level vs Support | 0.5% above 5d EMA | 1.0% above 0.382 retracement |
| Leading Sector Momentum | Semiconductors and Banks dual engine | Semi leader alone |
| Foreign Net Buying | Neutral to Bullish | Strong Bullish |
| Technical Risk | Top divergence concern | Weekly bottom divergence confirming |
The Nikkei 225's bank stock gains reflect interest rate expectations, while KOSPI relies more on semiconductor momentum alone. The difference in industry structures leads to different volatility characteristics. However, both indices have not entered significant overbought territory (RSI>70) and maintain bullish MA alignment, so short-term momentum remains favorable for bulls.
Conclusion
Today's opening performance of the Nikkei 225 and KOSPI is not mere random fluctuation, but a resonance upward after technical pattern completion. The Nikkei 225 needs to watch if the RSI top divergence can be resolved by volume, with short-term key level at 70,500; KOSPI has weekly bottom divergence as mid-term support, and if it can hold above 8,980, it will open a new rising leg. Investors should closely monitor whether volume increases in the afternoon session and whether the electronics rally can spread to other sectors. With global inflation data and major central bank rate decisions approaching, the sustainability of this technical rebound still requires macro 'wind' support.